

271Uploads
2054k+Views
2013k+Downloads
Whole school

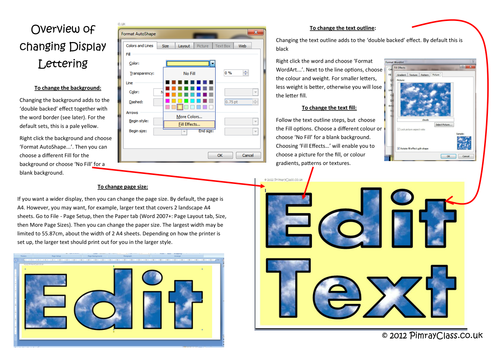
Display Lettering - 161 editable variations
Create lettering with 'double backed&' effect for your displays with matching borders and corners. 161 ready made editable display lettering sets (choice of 23 fonts, 7 fill variations) or edit your own text fill, text line, background, and size (use the pdf guide to help). Matching borders, corners and all text variations free to download from PrimaryClass.co.uk, as there are too many to host all on the TES resources site.
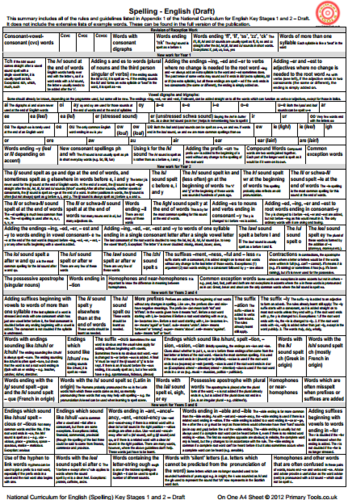
Primary Spelling Curriculum(Draft) On One A4 Sheet
This summary includes all of the rules and guidelines listed in Appendix 1 of the National Curriculum for English Key Stages 1 and 2 – Draft. It does not include the extensive lists of example words. These can be found in the full version of the publication. Full summaries of other areas of the draft curriculum available from the creators website.

2019 KS1 Reading Test and Question Level Analysis
Summary of Features (please note some features may not be available depending on the test type):
Pupil Summary shows total marks for each paper, number of questions unanswered (possibly indicating need to increase pace), number of incorrect answers, total overall score (and percent), total score in each strand. Option to adjust the colour thresholds to make it easier to spot patterns and gaps.
Pupil Reports show a summary of performance in each strand for an individual pupils. Available in 2017 versions and later excluding reading. 2018 versions and later contain detailed feedback on each question. Useful for feeding back to pupils, parents and informing intervention teachers.
Cohort Summary shows an overview of the cohort against each strand. This is also compared to national data where it is available. This page gives a summary of attainment including number and percent at expected and higher standard.
Strand Summary shows a the weighting of each strand and the performance within it. For example, in a grammar test a cohort may perform poorly in identifying sentence types and equally poorly in identifying punctuation. However as there is more weighting given to punctuation, it would be advisable to focus on this area.
Other Charts Charts which show performance for each question, organised by most correct to incorrect, by strand and also by year group question (for mathematics). The most powerful chart orders questions from most correct to incorrect enabling you to see precisely where there are strengths and weaknesses.

2019 KS2 Reading Test and Question Level Analysis
Summary of Features (please note some features may not be available depending on the test type):
Pupil Summary shows total marks for each paper, number of questions unanswered (possibly indicating need to increase pace), number of incorrect answers, total overall score (and percent), total score in each strand. Option to adjust the colour thresholds to make it easier to spot patterns and gaps.
Pupil Reports show a summary of performance in each strand for an individual pupils. Available in 2017 versions and later excluding reading. 2018 versions and later contain detailed feedback on each question. Useful for feeding back to pupils, parents and informing intervention teachers.
Cohort Summary shows an overview of the cohort against each strand. This is also compared to national data where it is available. This page gives a summary of attainment including number and percent at expected and higher standard.
Strand Summary shows a the weighting of each strand and the performance within it. For example, in a grammar test a cohort may perform poorly in identifying sentence types and equally poorly in identifying punctuation. However as there is more weighting given to punctuation, it would be advisable to focus on this area.
Other Charts Charts which show performance for each question, organised by most correct to incorrect, by strand and also by year group question (for mathematics). The most powerful chart orders questions from most correct to incorrect enabling you to see precisely where there are strengths and weaknesses.

2019 KS1 Reading Test Gap Analysis and Pupil Reporting
2019 KS1 Reading Test Gap Analysis and Pupil Reporting
Minor bug fix - 16_9_19

2019 KS2 Reading Test Gap Analysis and Pupil Reporting
2019 KS2 Reading Test Gap Analysis and Pupil Reporting
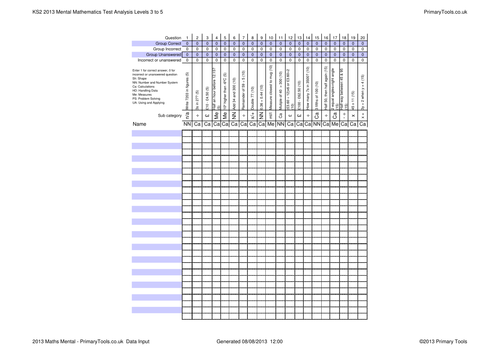
2013 KS2 Mathematics Test Analysis - Mental
Electronic Tool for analysis of KS2 2013 Maths Test - Mental. Also includes paper copy of input sheet for all of the mathematics tests. Other KS2 electronic analysis tools available.


2022 KS2 Reading Test and Question Level Analysis
2022 KS2 Reading Test and Question Level Analysis
Requires Excel with macros enabled.
Summary of Features (please note some features may not be available depending on the test type):
Questions Versus National compares the performance of your cohort against the performance of pupils nationally in each question. A powerful chart which instantly shows you which questions you are strong or weak on. As it uses national data, it considers the difficulty of each question, compares it the performance of your cohort and orders the results from strongest to weakest. 2016 to 2022 KS2 versions only, Q vs National will be added to the 2023 KS2 version at a later date.
Pupil Summary shows total marks for each paper, number of questions unanswered (possibly indicating need to increase pace), number of incorrect answers, total overall score (and percent), total score in each strand. Option to adjust the colour thresholds to make it easier to spot patterns and gaps.
Pupil Reports show a summary of performance in each strand for an individual pupils. Available in 2017 versions and later excluding reading. 2018 versions and later contain detailed feedback on each question. Useful for feeding back to pupils, parents and informing intervention teachers.
Contextual Analysis (2019 versions onwards) shows a breakdown by key groups (gender, SEND status, disadvantaged, EAL) plus up to four custom groups. Compares school data (grades and scaled scores) to national data in a detailed but user-friendly report.
Cohort Summary shows an overview of the cohort against each strand. This is also compared to national data where it is available. This page gives a summary of attainment including number and percent at expected and higher standard.
Strand Summary shows a the weighting of each strand and the performance within it. For example, in a grammar test a cohort may perform poorly in identifying sentence types and equally poorly in identifying punctuation. However as there is more weighting given to punctuation, it would be advisable to focus on this area.
Other Charts Charts which show performance for each question, organised by most correct to incorrect, by strand and also by year group question (for mathematics). The most powerful chart orders questions from most correct to incorrect enabling you to see precisely where there are strengths and weaknesses.
2022 Reading SATs
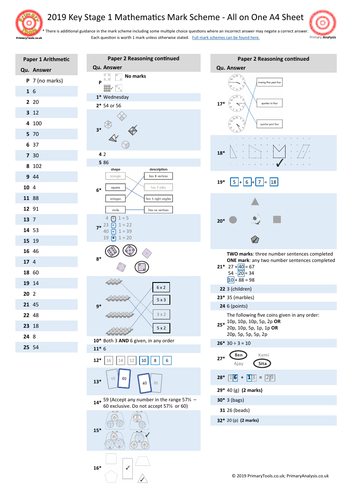
KS1 and KS2 2019 Maths Mark Scheme on a Page
KS1 and KS2 2019 Grammar Punctuation and Spelling Mark Scheme on a Page
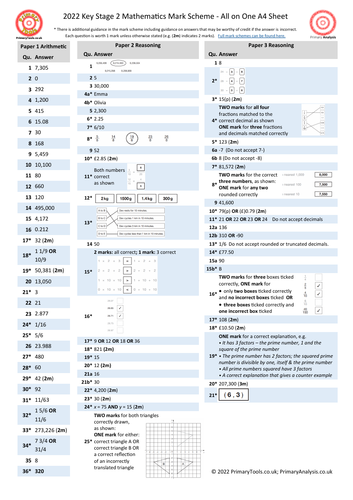
2022 KS2 SATs Mathematics Test Mark Scheme on a Page
2022 KS2 SATs Mathematics Test Mark Scheme on a Page

All kinds of editable certificates
Could not upload all of them here, more available form primaryclass.co.uk.